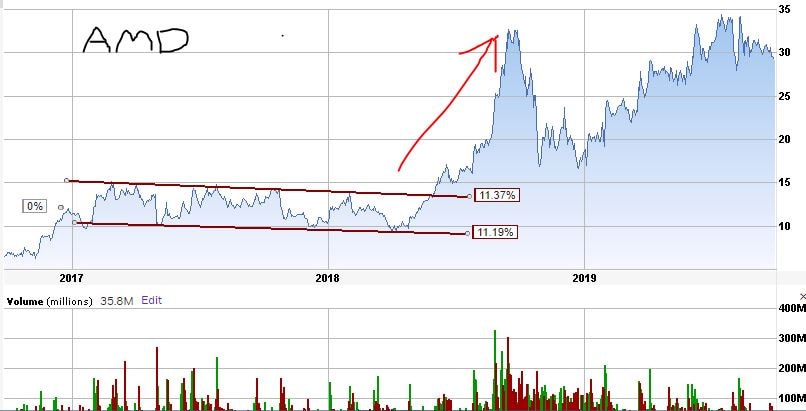
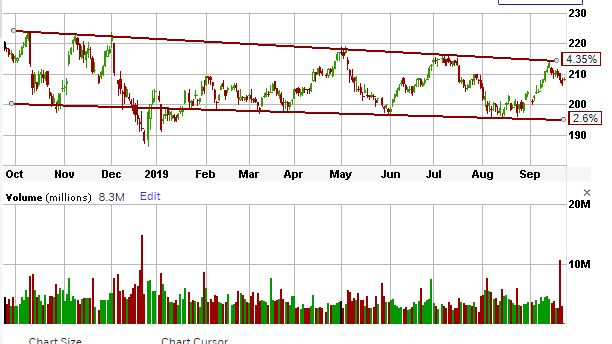
In the previous post I mentioned what happens when a long-time channel gets broken. The result is quite often an explosion in the direction of the break. Advanced Micro had a nice tight channel pattern that one could have traded for about a year and a half. Slightly lower highs and slightly lower lows (although usually about the $10 level on the low end). At any rate, just when someone was gonna put on their short on at the upper range of the channel during the middle of 2018, the top of the channel was broken. The right move would have been to cut losses and cover the short and (crazy sometimes as it seems) go long. The stock more than doubled in just a few months. I noticed this past channel and break because I am currently short with a put spread looking for slightly lower into October expiration.
A nice and simple way to trade is to use a defined visual channel. It does not matter much what the symbol is or whether the subject is stock or commodity or bond. This particular chart has a slightly declining range (somewhat lower highs and lower lows). Shorting the tops and buying the drops has seemed to work quite well for the past year and a half or so. This is actually Warren Buffet's baby (BRK.B - Berkshire). My last trade on this was a vertical put spread from just above the 210 area with the expectation of 195 to 200 by expiration in Oct. The idea is to make about 4 times the original trade if successful and then take the other side from 195/200 area back to the 210 region a month or two later. I should point out though that when long channels break one way or another they generally explode out in whichever direction: so stops are good ideas. Also, of course, timing is everything - so trading options a couple months out from expiration could help with that variable.
|
Paul SaadSenior Manager, Paul Saad and Associates, LLC Archives
May 2020
Categories |