As an add-on to the post below that describes the correlation between the 1999/2000 stock bubble and today's market, I am noticing another similarity: micro cap value vs growth (or pie in the sky I like to call it) is again out of sync. Back in the day it was "Brick and Mortar" vs "Dot.com" or more precisely, something that had profitable earnings vs the pie in the sky hopes of one day having earnings, with brick and mortar stocks dropping every day while the growth hype hitting extreme insanity. Same today... I just looked at a list of value micro caps I follow and today while the Dow/Nasdaq/SPY are all up insane amounts (1% on Naz) almost 80% of the value micro cap stocks are actually down on the day. Again, just a little bit anecdotal but strange to say the least. Perhaps the $0 commissions have mom and pop selling anything boring to free up some cash to get the shiny new TSLA stock at $950! Momentum does beget momentum in both directions (up and down) and where it stops... nobody knows. But must be getting close. Another similarity is energy... oil and nat gas stocks are crushed just as they were in 1999/2000 (but I suppose I am already putting these stocks in the "value" bucket)
|
I like looking back at the charts to see repeat patterns. This one below was pretty easy to see. In the late 90's when the Nasdaq was going hog-wild a few things happened to cause a hiccup and pullback - the Asian Crisis and the Russian Default - both of which killed Long Term Capital Management LTCM, which forced a bailout by the big banks (the Fed) and arrested the fall in the stock market exactly at the end of Sept 1998. The Fed of course cut rates too to help fuel the further exuberance. More recently, in our current hog-wild Nasdaq parabola (Tesla to $1,000 Robinhood traders!) we had the little 2018/2019 hiccup caused by the supposed tariff/trade fears, that of course the Fed came in to fix (mid cycle adjustment says Powell - like in 1998) and then the further (not QE) Repo balance sheet explosion. At any rate, now with the world's largest economy shuttered due to a zombie apocalypse virus in China, for some reason (mega central bank intervention) we have the market in the parabola continuation pattern. So I just thought I would look at the time interval from the Sept 1998 pullback to the ultimate Feb/March 2000 peak in the QQQs and extrapolate that to our current chart. So if history repeats and we keep our patterns nicely consistent, this current melt-up could last until April/May 2020? With many corporations around the world now saying they are gonna have a little bit of a problem getting supplies and may not be able to ship and cruise lines - airlines - freight lines - not budging, I have a hard time seeing that. Somewhere on the internet I saw a darkly comedic meme which stated something like: The year is 2023 and all humankind is wiped out. The unmanned computers at the Federal Reserve are continuing to bid up the Dow Industrial Avg to all time highs. Makes sense... 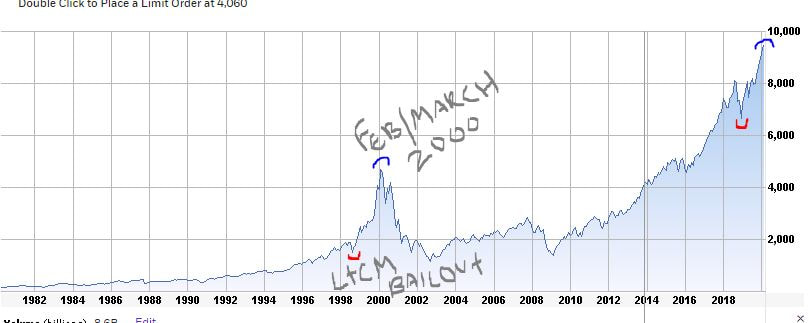 |

Paul SaadSenior Manager, Paul Saad and Associates, LLC Archives
May 2020
Categories |
 RSS Feed