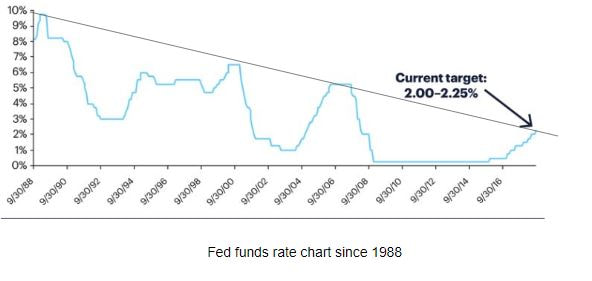
The Fed raised rates as expected yesterday and I heard from quite a few sources that rates may be higher but they are still historically low. Well that may be true in absolute terms but does anyone notice the trend on the chart? In previous cycles the Fed would raise then pause then start cutting when they overshot (with recession evident). This begs a couple questions, the first being how high is too high relative to past increases and second how low is the next low base as 0% is most likely not going to be the line in the sand. Negative rates will most certainly be in the bag.
When the market was falling apart in Jan/Feb of this year we sided with some technical analysts and decided that those all-time highs would need to be re-tested before a down leg could begin in earnest. Well the S&P and Nasdaq did their part and extended beyond and now the Dow has retested and is at all-time highs again. So we are approaching the levels of the crudely drawn upper trend line on the S&P (probably between 2930 and 2960) and this could be a good point to start putting on some shorts. Seasonality is at play here going into the spooky month of October and we are heading into earnings buy-back-black-out period (the first week of October about 85% of companies will be prevented from buying their stock) so it may be safe for some bears to start romping for a trade. However we are not getting the "recession is imminent" signal yet so the longer term bear trade is still up in the air. I guess we will play it by ear (and watch the leading economic indicators).
Disclosure: starting to short S&P |
Paul SaadSenior Manager, Paul Saad and Associates, LLC Archives
May 2020
Categories |